Open results panel
To visualize results as an overlay over the original slide: you need to open the slide in the image viewer
- Open a slide in the image viewer
- Open Slide list panel, if not already expanded, by clicking on the button
- Click on the tab
If no results are available there will be a message indicating that. Otherwise you will see options to select a result to visualize.
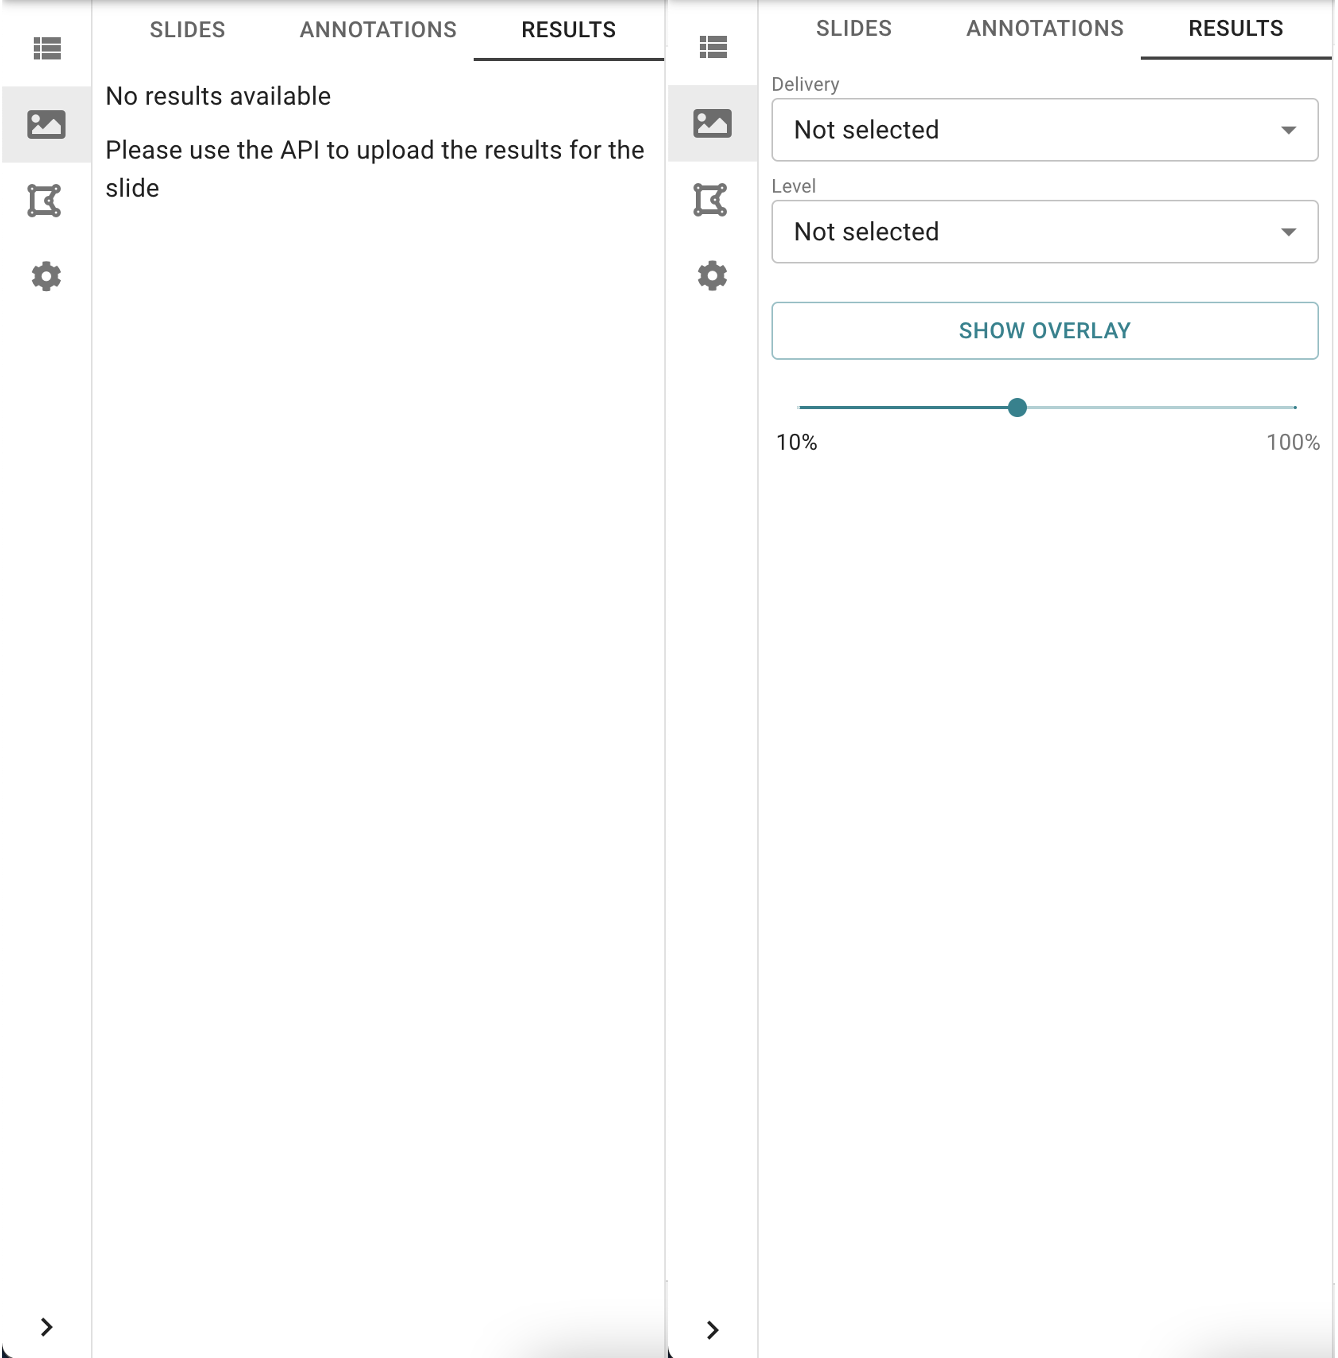
Image: Left: No results available for visualization, Right: Results are available for visualization
Visualize all classes
To visualize all classes of a DRC result:
- From the Delivery dropdown select a result which you want to visualize
- From the Level dropdown select the level which you want to visualize
- Click on the button
This will display all classes available in the selected Level.
Tip: Default selection
- By default, clicking on the Result tab will select the Cell Level of the last delivery, if that level exists. It will also turn the overlay on.
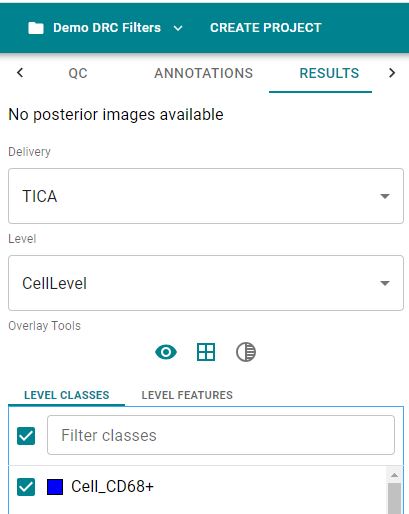
Image: Classes available for the selected Level and Delivery
Toggle object outlines
By default, objects are shown with a black 1 pixel inner outline. Click on the button to remove the black outline and display objects without borders. It generally looks cleaner, but you will not be able to see the borders between touching objects of the same color anymore.
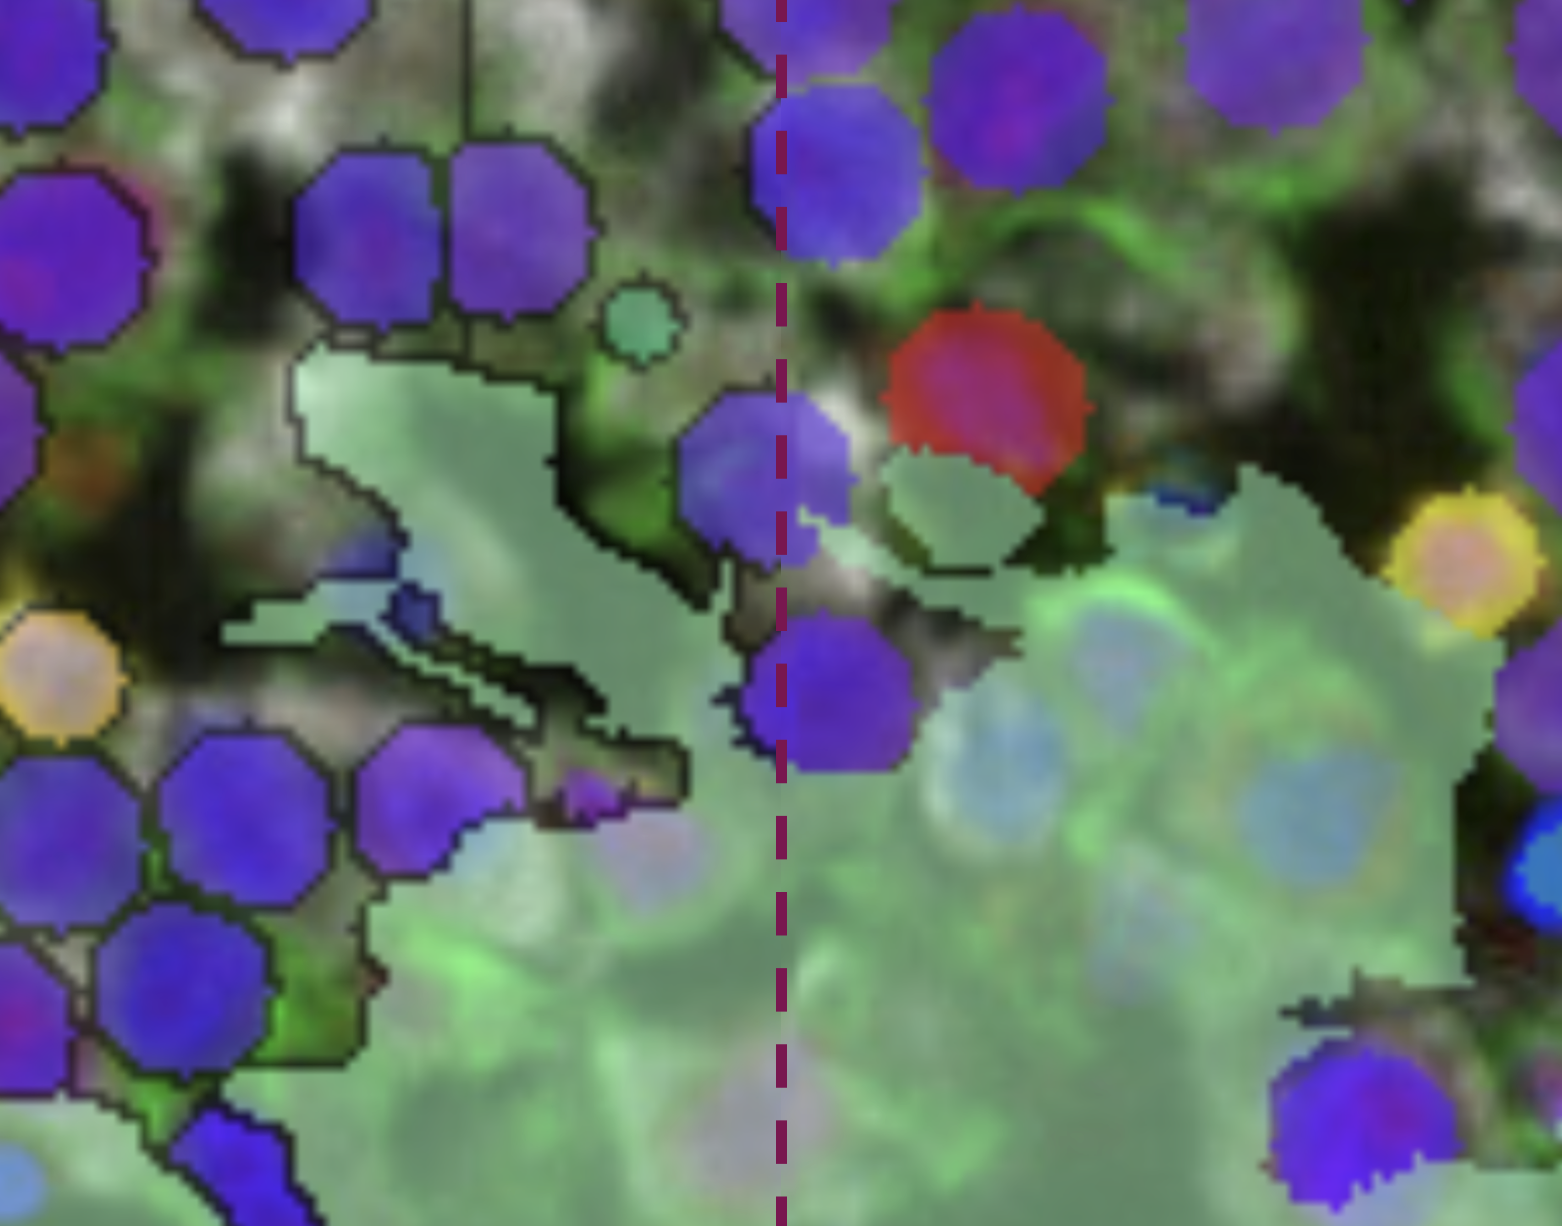
Image: Comparison of the same DRC overlay with (left), and without (right) outlines shown
Change overlay transparency
To change the transparency for the results overlay:
- Click the icon to display the opacity slider
- Moving the slider to the left will increase transparency (decrease the opacity) of the results overlay
- Similarly, moving the slider to the right will decrease transparency (increase the opacity) of the results overlay
By default the transparency slider is set to 50%. Drag the slider or click on any position of the slider to change the opacity.
Image: Left: Results overlay with 20% opacity, Right: Results overlay with 70% opacity
Display individual classes
In the Level Classes section you can select individual classes you want to display by checking the box in front of the class you want to visualize. When selecting a Level, all classes are selected and visualized by default.
Select and unselect all classes
Clicking on the checkbox on top of the list will:
- select all classes, if only some or none are selected
- unselect all classes, if all are selected
Find the right class
Using the Filter Classes box you can quickly filter the list of classes to the ones you want to select or unselect from the entire list of all available classes.
Tip: Subsetting classes
- Combining the classes filter with the select/unselect all checkbox you can quickly hide or show a subset of all available classes.
Unselect a subset of classes
To unselect a subset of available classes:
- Click in the Filter Classes box
- Type in a search term
- Click on the checkbox
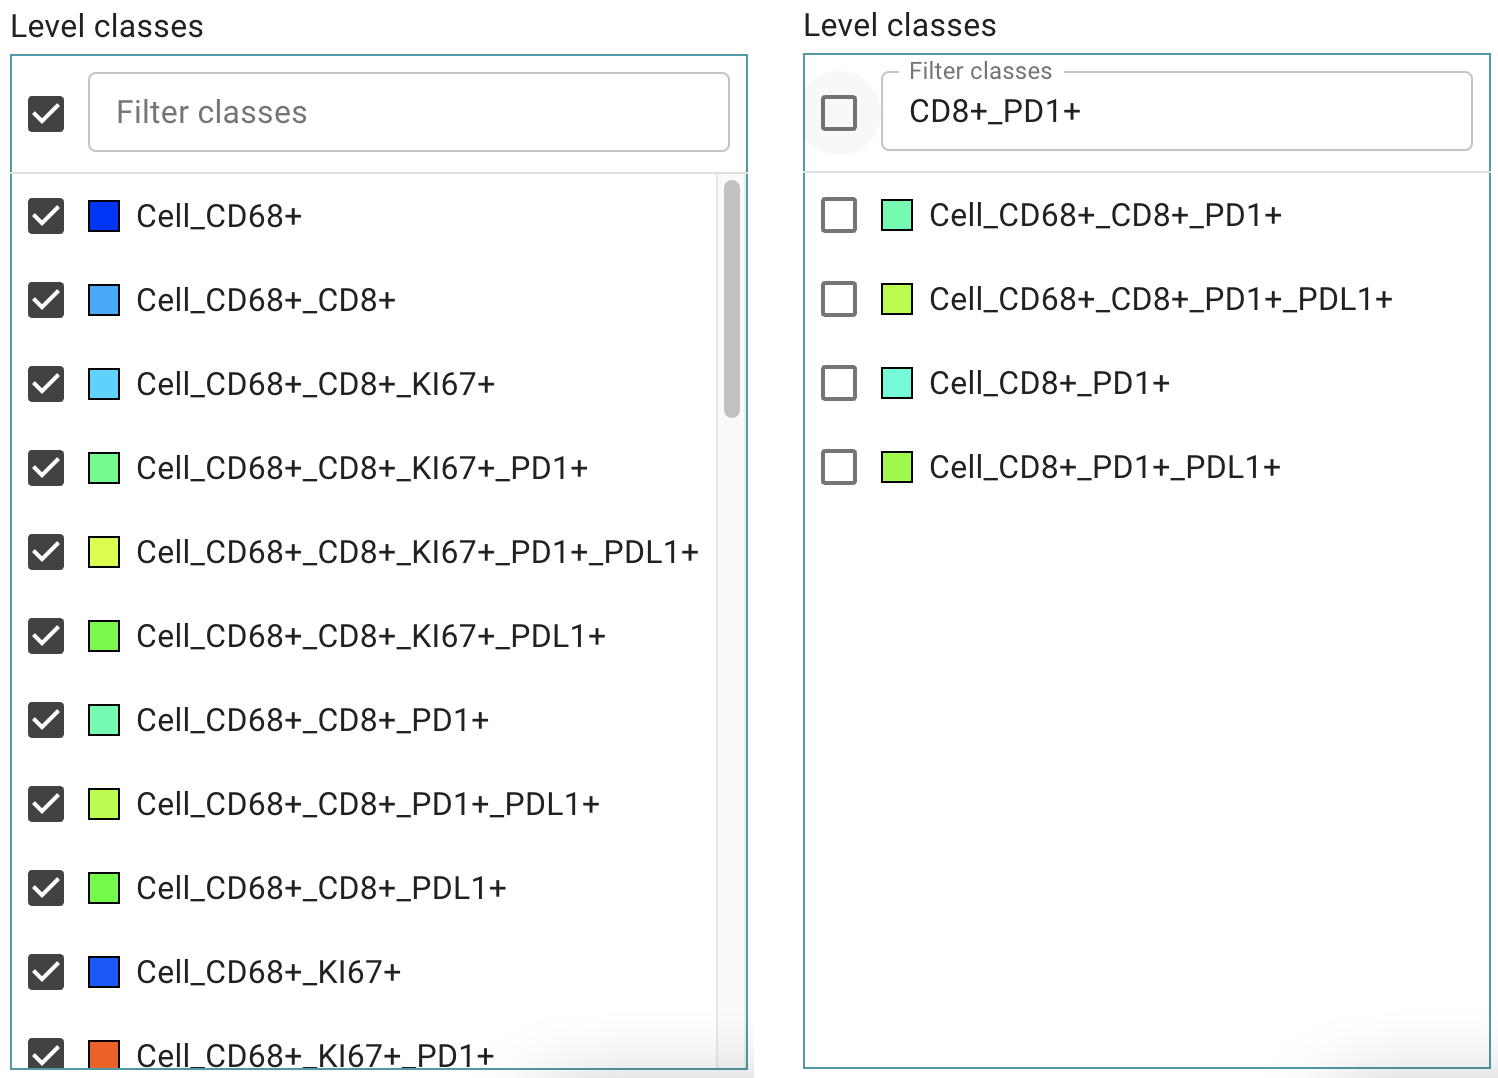
Image: Left: List with all available classes, Right: Filtered list of classes to be hidden
Object feature filtering
To use advanced visualization options, click on the tab, after selecting the delivery and its level.
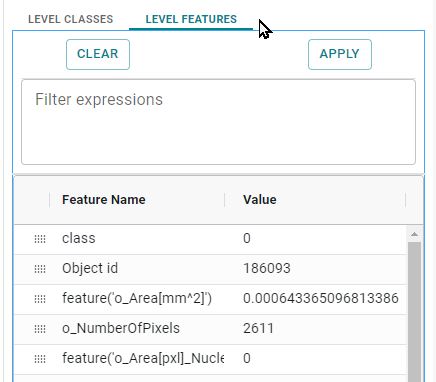
Image: Object feature filtering in the Results tab
Viewing object variable values
While in the tab, a list of all existing object variables is displayed. Only standardized and registered variables will be shown. If you cannot see any variables, the creator of the result (DRC) may have skipped the registration step. Please align with the creator of the DRC if you cannot see any variables here.
While the tab is active, hovering over individual objects will update the value filed with the objects' feature values. To ensure precision, please make sure that the size of the objects is reasonable in terms of zoom level, e.g. investigating single cells should be done at least at 20x magnification level.
Clicking into an object will set a “pin” to the location of the click and freeze the variable values. Clicking one more time will unlock the freeze again. Of note is that holding the mouse button still enables panning of the image.
Advanced filters for object visualization
The textbox allows to type or copy&paste expressions to update, set color and name, and visualization of result objects.
Click to update the overlay according to the expression in the text box.
Click to delete the text in the textbox and reset the view.
It is highly recommended for first time users to start by copy&pasting prewritten examples into the textbox. Below the textbox, there is a list of the existing variables in the dataset. You can click on them to add them to the textbox. Sometimes clicking a variable will show a similar, but different name in the textbox. This is due to mapping of the original DRC data to match the pathology dictionary. Textbox will show the correct name that is used for filter expressions.
In general, use either of the two syntaxes:
{CLASS_NAME} #{CLASS_HEX_COLOR}: QUERY
or
#{CLASS_HEX_COLOR} {CLASS_NAME}: QUERY
with the query being
{variable_name} = (or other conditions) {value}
Common examples
It is always recommended to add a color and a new class definition, as shown below.
#00FFFF CD68: isPositive_CD68 = 1
This will display objects with a new name "CD68" in the color cyan defined by the hexcolor code #00FFFF. Here is an example using RGB colors. The variable used is “isPositive_CD68”, the condition “=”, and the value “1”.
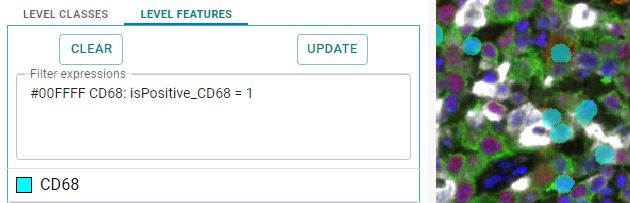
Image: CD68 positive cells shown in cyan as overlay
rgb(157,181,153) CD68: isPositive_CD68 = 1
This rule will use all objects that have the variable/feature "isPositive_CD68" set to "1". You can add two more digits (7,8) to set transparency. The transparency slider can be then used to further adjust (lower) the current values multiplicative:
100% — FF
95% — F2
90% — E6
85% — D9
80% — CC
75% — BF
70% — B3
65% — A6
60% — 99
55% — 8C
50% — 80
45% — 73
40% — 66
35% — 59
30% — 4D
25% — 40
20% — 33
15% — 26
10% — 1A
5% — 0D
0% — 00
Alternatievly, you can specify the RGB values (three numbers), with the 4th value between 0 and 1, to set the transparency.
rgb(157,181,153, 0.1) CD68: isPositive_CD68 = 1
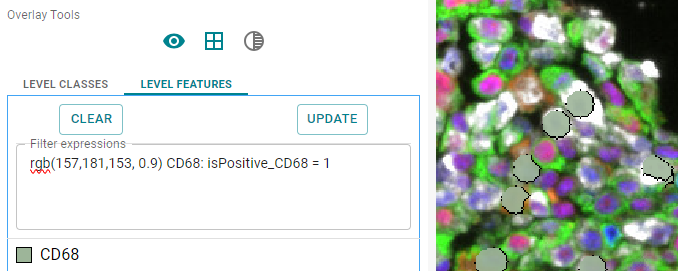
Image: CD68 positive cells shown in dark green as overlay
Similar to above, this will display objects that are called "Large CD68" in the same color, but this time only for object that have 100 or more pixels, as defined by the feature o_NumberOfPixels. Note that the "and" condition is used, so only objects that are both large and have "isPositive_CD68" = 1 are chosen.
#00FFFF Large CD68: isPositive_CD68 = 1 and o_NumberOfPixels >= 100
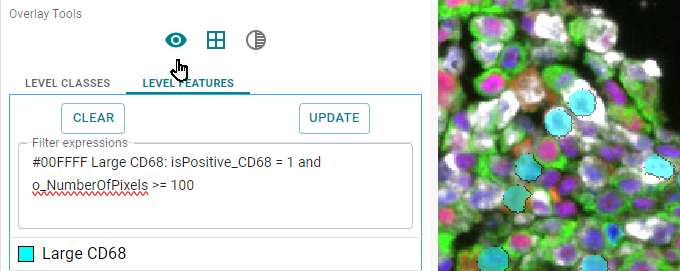
Image: CD68 positive objects, with 100 or more pixels, shown in cyan as overlay
To visualize small and large cells in different colors,
you can use expressions below. Using 250 as the threshold
to split large and small cells, produced a fair amount of
both types on this example dataset.
Combining any number of “rules” allows you to nicely
investigate your image results based on different
biomarkers that are stored in object feature values.
#00FFFF Very Large CD68: isPositive_CD68 = 1 and o_NumberOfPixels >= 250
#FF00FF Smaller CD68: isPositive_CD68 = 1 and o_NumberOfPixels <= 250
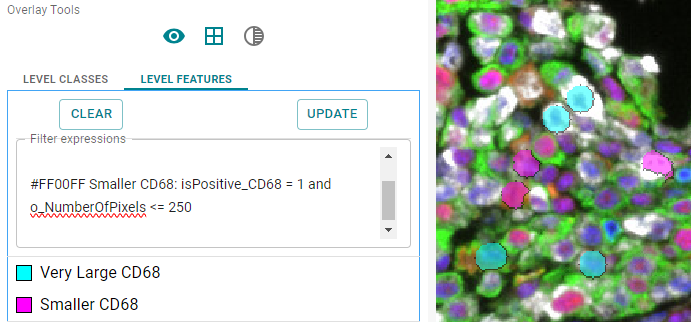
Image: Objects smaller than 250 pixels are shown in pink color. Objects larger than 250 pixels are shown in cyan color
More useful syntax examples
The following syntax can be used to set bins, e.g. to create heatmaps for a variable. It is recommended to generate longer heatmaps rules with python instead of manually typing them. Here is a python example: heatmapGenerator.py .
inrange(0.3,feature_name,0.5)
The following expression, using the "and" operator, will show only cells that are positive for both biomarker variables at the same time!
#00FFFF doublePositive: isPositive_CD68 = 1 and isPositive_CD8 =1
Very similar, but using the "or" oeprator will pick all cells that are positive for one, the other, or both.
#00FFFF bothCD8andCD68: isPositive_CD68 = 1 or isPositive_CD8 =1
You can also use the name of the classes or the class ID, which are displayed in parenthesis in the table.
classname = (classname = 'Cell_KI67+' and o_Length >1) or (classname='Cell_PDL1+' and o_Width >1)
This example uses parenthesis to show 2 type of cells based on their name in single quotes and a variable. Not setting a color or a new class will use the original colors and not update the legend. It is recommended to work with variables instead of class names since that produces a legend with updated colors for clarity on what is being displayed.
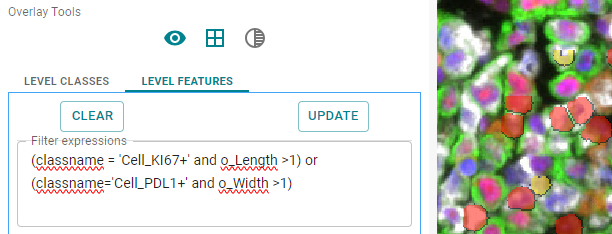
Image: Objects shown based on the name criteria in their original colors
classname != 'Cell_Tumor_PDL1+_KI67+'
This expression uses the negation and shows all classes except the class listed.
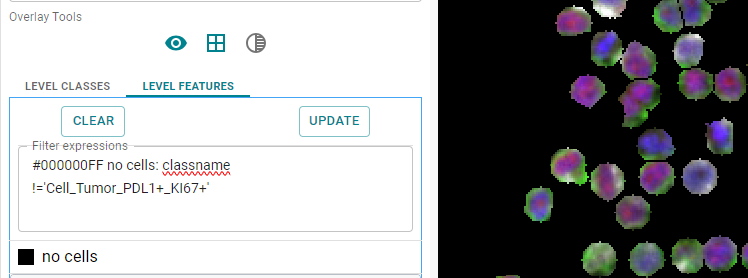
Image: All except negated classes are shown
You can, for example, use
RGB to Hex
website to generate a hex code for colors of your choice.
Outlines are only possible either for all objects or none,
so use the button for outlines instead. Expressions that
can be used, are
taken from here.
Please note, that we did not test every single function,
but they should be working out of the box. Please keep in
mind that many of these expressions should not be tried in
the browser on large DRC data. For example, there should
be no reason to calculate integrals or sine functions in
the browser on DRC data.
More filter examples for mIF-like projects can be found below.
Area
Annotated area (AA)
Excluded #A0FFC0: o_isEX = 1
Annotated Area #FFFFFF: o_isAA > 0
Invasive margin (IM) and tumor center (TC)
Excluded #A0FFC0: o_isEX = 1
Invasive Margin #FFFF00: o_isIM > 0
Tumor Center #AA0000: o_isTC > 0
Tumor and epithelium regions
Excluded #A0FFC0: o_isEX = 1
Tumor Region #FF0000: o_isTR > 0
Cells
Cell CD8+. It includes all cells which are CD8-positive, including the ones which are positive for other markers in addition
Excluded #A0FFC0: o_isEX = 1
Cell CD8+ #FF0000: isPositive_CD8 > 0
Cell CD8+KI67+. It includes all cells which are CD8-positive and KI67-positive, including the ones which are positive for other markers in addition
Excluded #A0FFC0: o_isEX = 1
Cell CD8+KI67+ #FF0000: isPositive_CD8 > 0 & isPositive_KI67 > 0
Cell CD8+KI67-. It includes all cells which are CD8-positive and KI67-negative, including the ones which are positive for other markers in addition
Excluded #A0FFC0: o_isEX = 1
Cell CD8+KI67- #FF0000: isPositive_CD8 > 0 & isPositive_KI67 = 0
View posterior images
You can view posterior images as overlays in the image viewer. Posterior images are automatically scaled to match the underlaying slide when being viewed in the image viewer, if the posterior and the slide have the same aspect ratio.
Open a slide in the image viewer, which has posterior images uploaded to the CP Portal.
- Click on the Results tab
- From the Posterior drop-down, select a posterior you want to visualize
A posterior image will be visualized as an overlay, over the already displayed slide in the image viewer. Additionally, this will give you access to : a set of visualization tools, specific to posterior images.
- Hide/Show overlay: Hide or show the posterior overlay
- Channel range: edit the value range of the channel
- Color: change the color of the overlay
- Channel as alpha: toggle channel as alpha on or off
- Transparency: change the transparency of the overlay